The Numbers Behind the Miss
The Trade Desk grew revenue 3% year over year in the second quarter. Wall Street wanted 8.3%. That gap is the whole story of why the stock is trading where it is today.
A 3% quarter for a company that's compounded well above 20% for most of its public life isn't a rounding error. It's a growth story losing its growth. Q3 guidance landed at $650 million or better, a number the market read as soft rather than conservative, and shares are now down 74.5% over the past twelve months and 36.99% over the past three months alone. The stock trades 75.59% below its 52-week high of $55.56, a gap that would have looked unthinkable a year ago for a company that once anchored the connected-TV advertising trade.
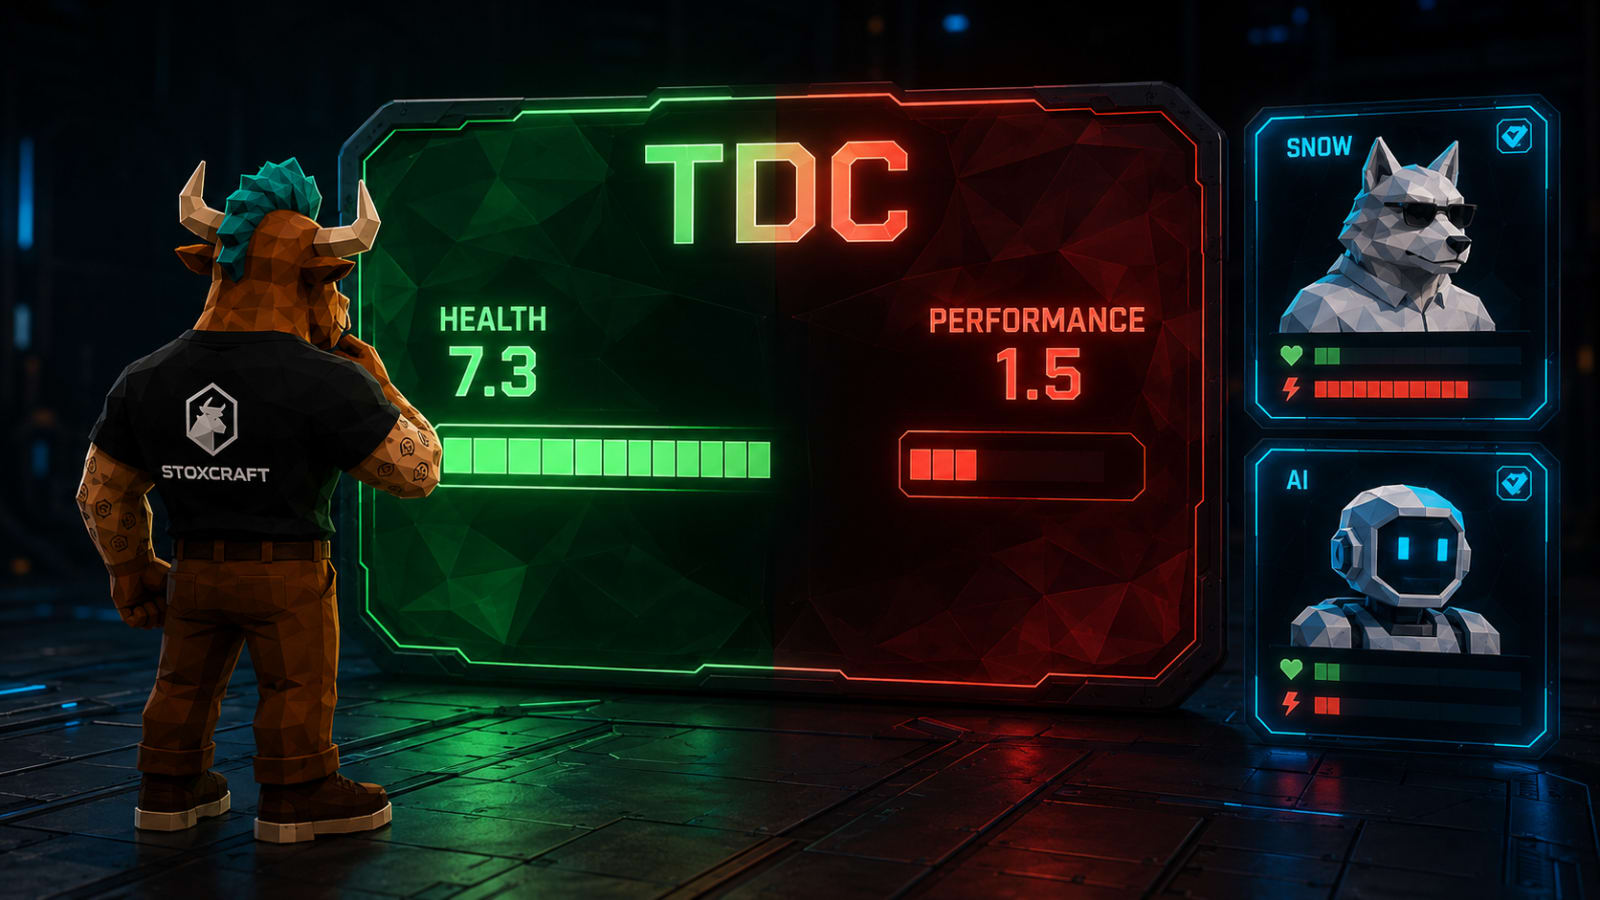
Stoxcraft's scores had already been tracking the deterioration before this print confirmed it. The Health Score sits at 5.6, not collapsed but clearly softer than a year ago, and the Performance Score has bottomed out at 0, the lowest reading on the scale. An RSI of 28.55 puts TTD in oversold territory, the kind of technical reading that shows up when a stock has been sold hard and fast rather than drifting lower over time.
What hasn't broken is the balance sheet. Operating cash flow over the trailing year sits at $992.7 million, free cash flow per share reads $1.76, and a current ratio of 1.61 says short-term obligations aren't a near-term concern. Net profit margin over the trailing twelve months still runs 14.57%, and return on equity sits at 17.84%, numbers that don't match a company in genuine distress. That's the tension running through this entire story: a company still generating real cash, priced by the market like the growth engine behind that cash has stalled out for good.
A Leadership Shakeup at the Same Time
Growth numbers alone rarely move a stock's Risk Score by 0.7 points in a single day. A simultaneous exit of the CFO, CMO, and commercial chief does.
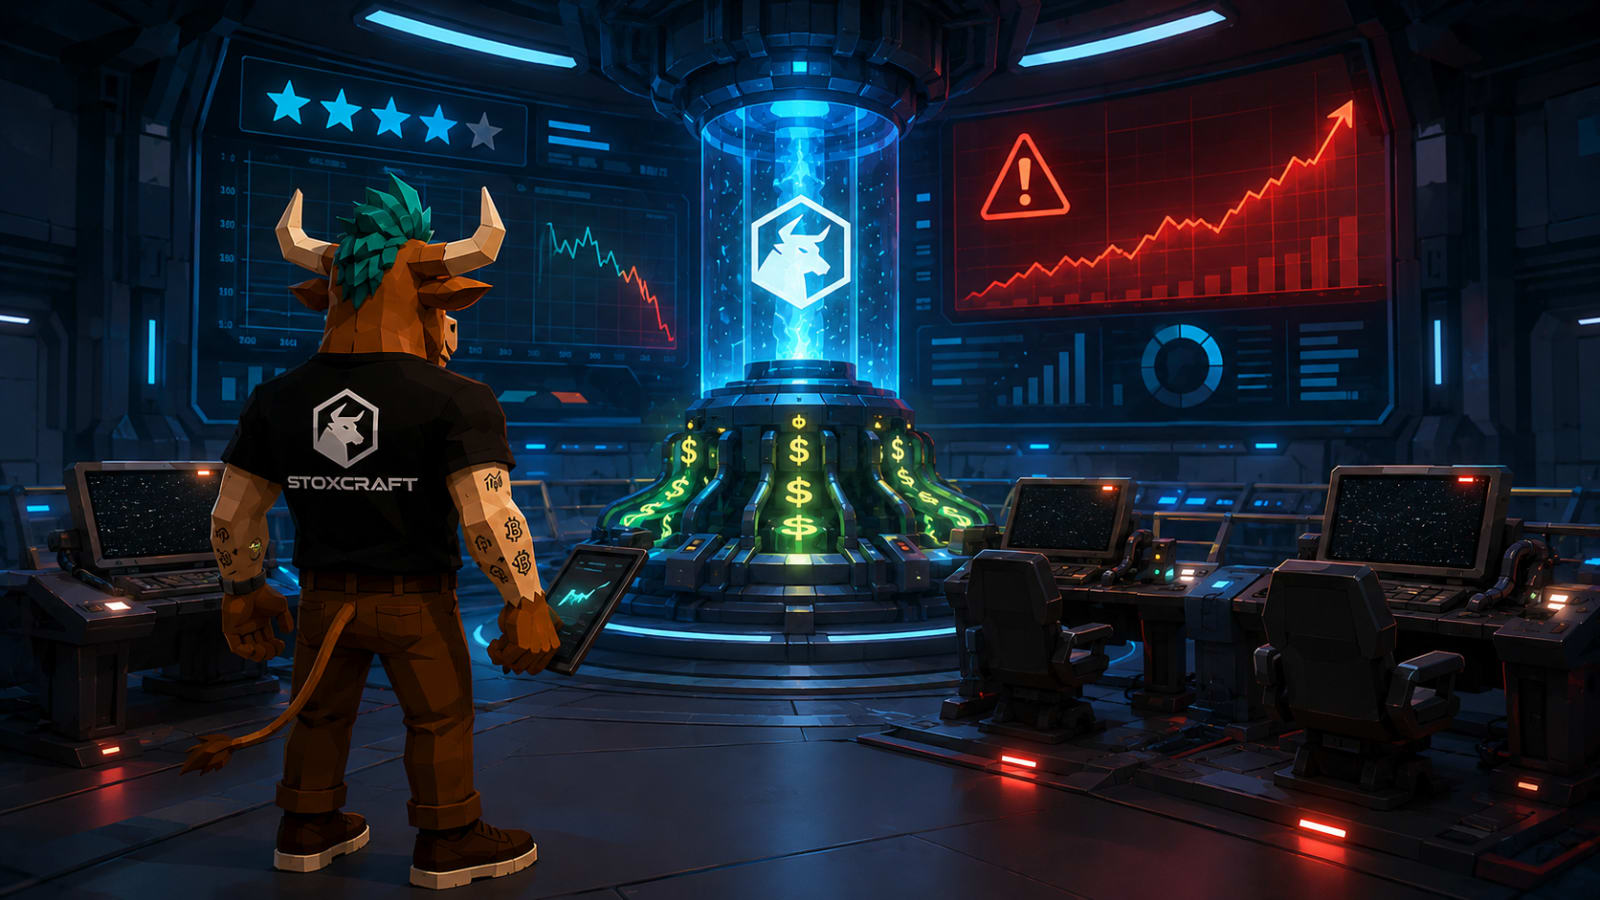
Three C-suite departures landing in the same window as a guidance miss reads as more than a coincidence to investors, and Stoxcraft's Risk Score agreed: it jumped from 7.5 to 8.2 on August 8, the same window the Overall Rating fell from 2.0 stars to 1.0. That's a fast move for a score meant to reflect volatility and downside exposure across the full Stoxcraft universe of roughly 3,900 stocks, not just one company's headline news. A finance chief leaving mid-cycle raises its own questions, but losing the commercial chief and CMO at the same moment points to something broader: a company resetting its go-to-market approach at exactly the point competition in connected TV and retail media is intensifying.
The buy signal, notably, still reads Buy. That's not a contradiction so much as a reminder of what the signal actually measures: an analyst price target of $15.89 against a $13.56 share price implies real upside if the business stabilizes. The Overall Rating and the buy signal are answering different questions, one about where the stock has been, the other about where analysts think it's headed next. Right now they disagree, and that disagreement is worth watching heading into the next quarter's print, especially once a new commercial leadership team is actually in place and running the playbook.
How Unity and PubMatic Compare This Week
Ad tech isn't having a great week, and The Trade Desk isn't the only name showing it.





Unity, the closest software peer by market structure, carries a Health Score of just 1.3, the weakest of the three, alongside a Risk Score of 7.6. Its Performance Score of 3.7 looks stronger on the surface, driven by a 42.02% one-month gain and a 104.90% six-month move, but that kind of short-term spike paired with an RSI of 82.30 reads closer to overbought momentum than fundamental strength. PubMatic sits in between on most measures: a Health Score of 2.2, a Risk Score of 6.8, and a Performance Score of 4.6, the best of the three, backed by a 30.26% one-month move and a 78.64% three-month gain of its own. Both names, like TTD, still post negative net income over the trailing year.
None of the three carries a Rating above 1.5 stars right now. That's the real takeaway from putting them side by side: this isn't a single-company leadership story, it's a sector under pressure where the news cycle happened to pick The Trade Desk to lead the headlines this week. Unity and PubMatic's charts have been more volatile day to day on pure price action, but their scores say the underlying caution applies just as much to them as it does to TTD.
For a company that's spent a decade compounding growth on the back of programmatic ad spend, a 3% quarter and a leadership exodus landing in the same week is the kind of setup that either marks a bottom or the start of a longer reset. The next two quarters, not this one, will answer which. A new CFO can rebuild investor trust in the numbers. A new CMO and commercial chief have to rebuild something harder: the growth story itself, at a moment when connected TV ad dollars are being fought over by more platforms than ever. Track TTD, U, and PUBM's scores as they update on the Stoxcraft Screener, and see what else is reporting this week on the Stoxcraft earnings calendar.
Disclaimer: This article reflects data as of publication and is for informational purposes only. It is not financial advice. Stoxcraft Scores are quantitative indicators, not buy or sell recommendations.