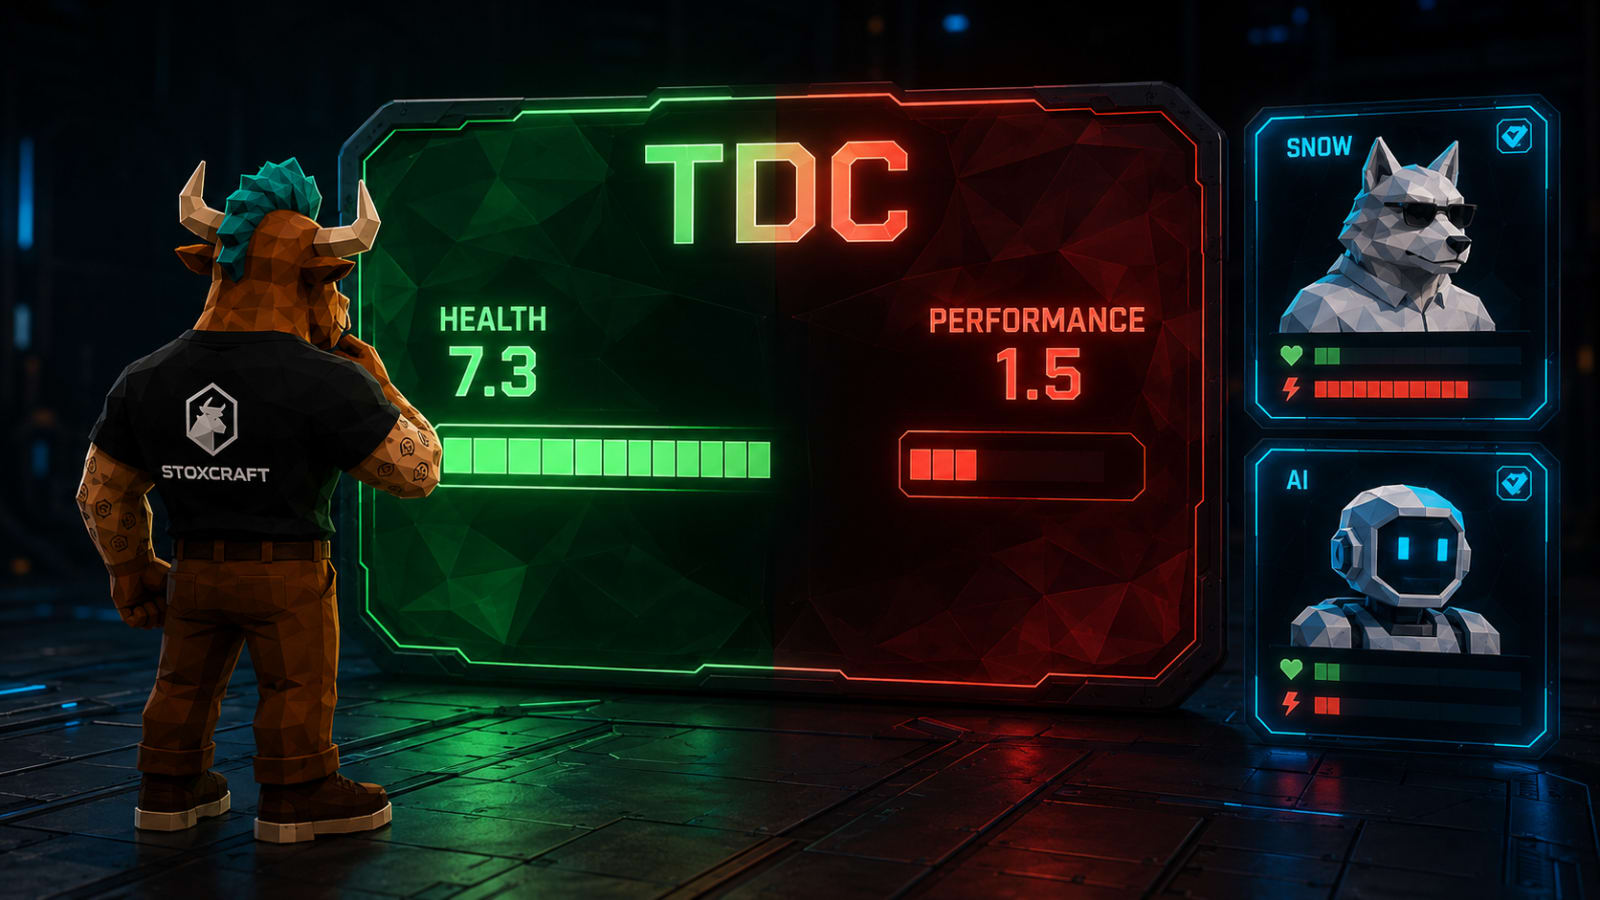
The Fundamentals Behind the Health Score
Teradata's Health Score sits at 7.3, one of the stronger fundamental profiles among small and mid-cap Software - Infrastructure names Stoxcraft covers.
The number is backed by real numbers, not sentiment. Net profit margin over the trailing twelve months runs 24.9%, return on equity sits at 56.5%, and the Piotroski Score, a 9-point checklist of balance sheet and profitability quality, reads 8. Free cash flow per share of $7.30 gives the company real flexibility, whatever the stock price does next.
That's a meaningfully different picture than the one the share price alone would suggest. Teradata trades at a 22.1 P/E on $1.66 billion in annual revenue and a $2.58 billion market cap, modest multiples for a company generating this much free cash flow relative to its size.
Why the Performance Score Doesn't Agree
The Performance Score tells a different story entirely: just 1.5, deep in the bottom tier of the Stoxcraft universe.
The move has been fast. The score dropped from 2.6 to 1.3 in a single week in early August before settling at 1.5, tracking a share price that's down 17.9% over the past month and 12.4% over three months. Zoom out further and TDC is still up 37.4% over the past year, but down 38.7% over three years and 46.1% over five, a longer downtrend the recent bounce hasn't undone.
Risk has moved in step. The Risk Score jumped from 5.8 to 7.0 in the same early-August window, and a 10.0% max drawdown over the trailing year confirms the volatility is showing up in the price action, not just the score. The Overall Rating followed, sliding from 2.5 to 2 stars on August 6 after bouncing between the two levels for most of July.
Snowflake and C3.ai: Two Different Patterns
Neither of Teradata's closest comparisons, Snowflake and C3.ai, shows the same split.






Snowflake runs the inverse: a Health Score of just 2.7 against a Performance Score of 7.2, with shares up 119.6% over three months on momentum that isn't showing up in the fundamentals. C3.ai has neither side of the trade working, a 1.2 Health Score and a 1.0 Performance Score, with shares down 36.9% over the past year and a Piotroski Score of just 1.
The chart makes the same point the scores do. Snowflake's momentum is real, C3.ai's decline is real, and Teradata sits in between, closer to the fundamentals than to either extreme.
Put the three side by side and Teradata is the only one where the balance sheet argues for the stock more convincingly than the chart does. That's not a signal to treat the Performance Score as noise. A 5.8-point gap between Health and Performance says the market is actively discounting fundamentals it doesn't currently trust, and that discount can persist a lot longer than a single earnings cycle.
What it does mean is that anyone screening TDC purely on the stock chart is missing half the picture, and anyone screening purely on the balance sheet is missing the other half. The Stoxcraft Screener lets you check both sides for any stock in a few clicks.