The logic behind Stoxcraft scores
Everything in Stoxcraft follows a logic. We reimagine the way stock metrics are shown. Instead of overwhelming spreadsheets, we take inspiration from game UIs and the way stats appear in sports or RPGs.
Our data comes from a premium source, updated multiple times a day, covering hundreds of metrics across financials, performance, news, and more.
But we do not just dump numbers on you. We shape them into scores that feel intuitive, almost like second nature. Up next, we will break down these scores, not just so you get them but because transparency matters.
A new way to visualize the stock market
You have seen charts, tickers, endless tables. But never stock data turned into cards you can read in seconds.
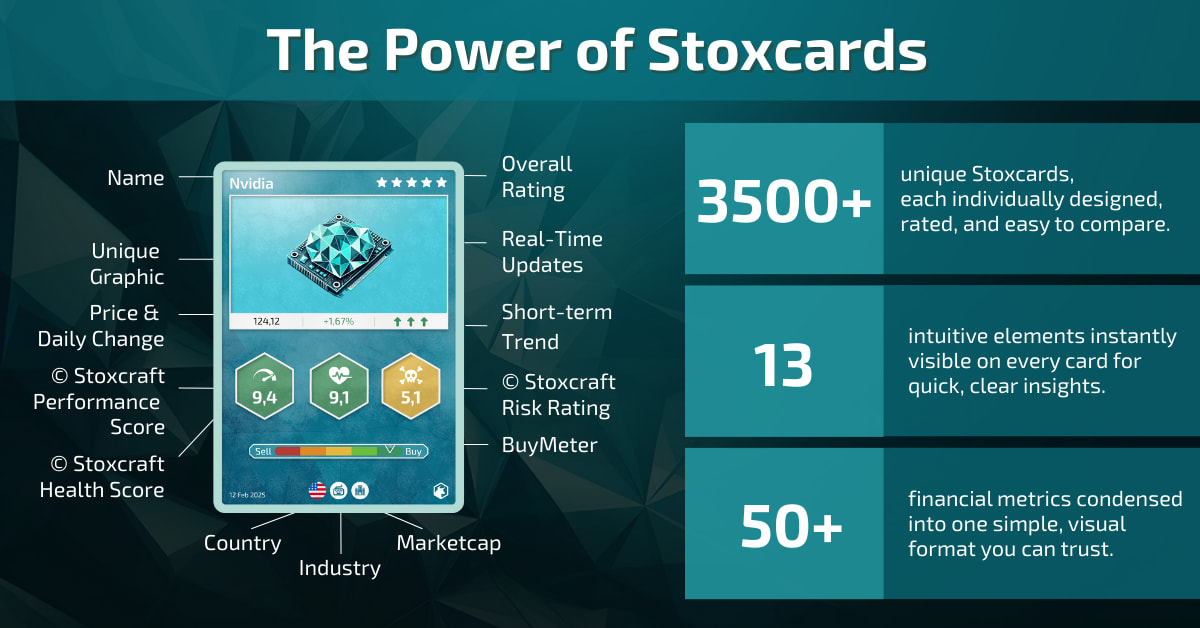
When you look at our Stoxcards, they feel oddly familiar, right?
That is because we all grew up understanding cards like these without even thinking about it. Whether it was Pokémon, Magic, sports stars we collected, or even simple card games, reading stats on a card feels natural.
We have taken more than 50 financial metrics and translated them into 13 custom-built scores, all packed into cards you can grasp at a glance. And since plain numbers and icons would be boring, we have created over 3500 unique card designs to bring them to life.
We want you to build a real connection with your stocks, feel motivated to explore them, and actually enjoy the process. Because investing should not feel like a chore.
Let us walk you through how each score works.
Core scores: health, performance and risk
Our custom Core Scores show you instantly how healthy a company is, how strong its performance looks, and how risky the investment could be.
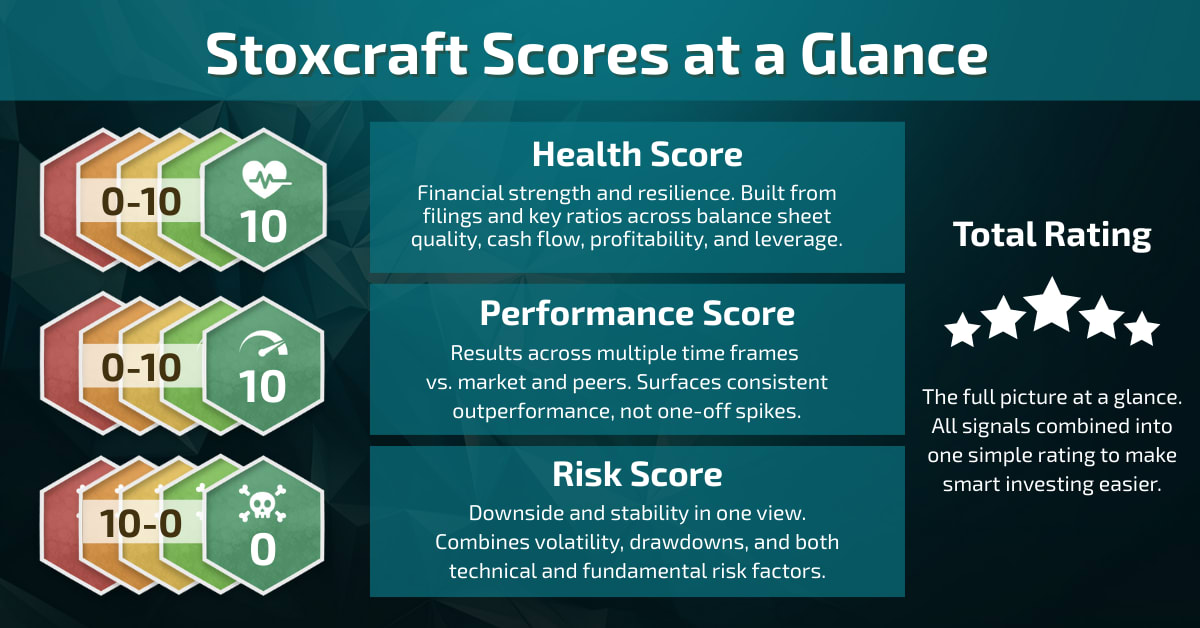
The foundation of our ratings is built on three Core Scores: Health, Performance, and Risk. Together, they form the basis for our star rating system.
Even if you have never heard of a company before, these scores help you quickly understand its financial strength and stability. We benchmark multiple performance metrics to give you a real sense of how well a stock is doing compared to the market and its peers. And we want you to decide for yourself how much risk you are willing to take.
Transparency matters to us, which is why we will now explain how each score works in detail. Take your time with this chapter, it will help you understand the magic behind the system.

Total Rating - The full picture at a glance.
The Stoxcraft Star Rating brings Health, Performance, and Risk together into a single view. It is the shortcut that shows you instantly how strong a company looks overall.
But the stars are not handed out lightly. To earn five stars, a stock must be both financially healthy and consistently outperforming the market, while staying within acceptable risk levels.
A higher star rating means a stock has proven itself across the board. It is the fastest way to spot quality at a glance.
Health Score - How stable and strong
a company really Is
The Health Score is independent from stock performance. It focuses on how profitable, liquid, and solvent a company is.
Does it generate steady cash flow? Are margins solid? How does return on invested capital stack up? Can it comfortably cover its interest payments?
We break down each company’s financial reports and benchmark them within their industry. A high Health Score means you are not just keeping up with peers—you are the meta inside your sector.


Performance Score – How strong is
the performance really?
Depending on the market, 20 percent returns can look amazing or just average. And who really remembers a stock’s performance three, four, or five years back?
Our database does. The Performance Score tracks multiple timeframes and benchmarks them against the market, so you see how a stock truly compares.
A high Performance Score means a company has outperformed the market for at least five years, holding steady through highs and lows.
Risk Score – How much risk are you
really taking?
Every stock carries risk, but not all risks are equal. The Risk Score shows how volatile a stock is, how much it can draw down in tough markets, and how leveraged the company really is.
We benchmark factors like drawdown levels, beta, and price swings to reveal the true risk profile.
A high Risk Score signals higher volatility and weaker balance sheets, while a lower score points to stability and smoother return.

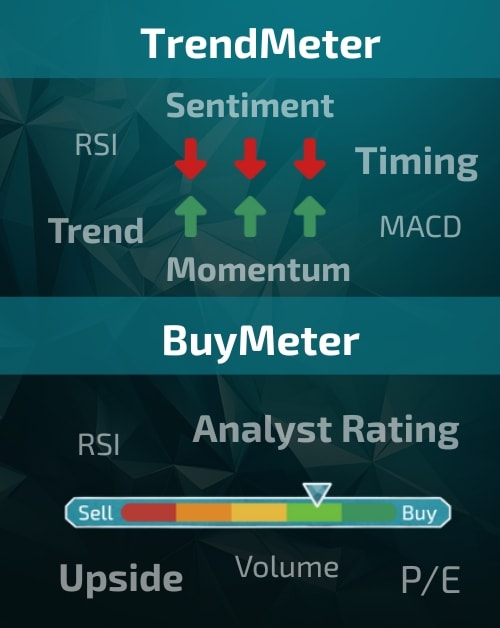
Trend & BuyMeter –
Timing meets sentiment
While the Core Scores show fundamentals, the Trend Score and BuyMeter capture what is happening right now.
The Trend Score tracks momentum, recent performance, and market signals so you see if a stock is gaining or losing steam. The BuyMeter layers on sentiment and short-term indicators like analyst ratings, price targets, and upside potential.
Together they reveal how the market views a stock in the moment. Strong trends and a high BuyMeter suggest demand is building, while weaker scores hint at caution.
Build your first portfolio and see for yourself how simple it really is