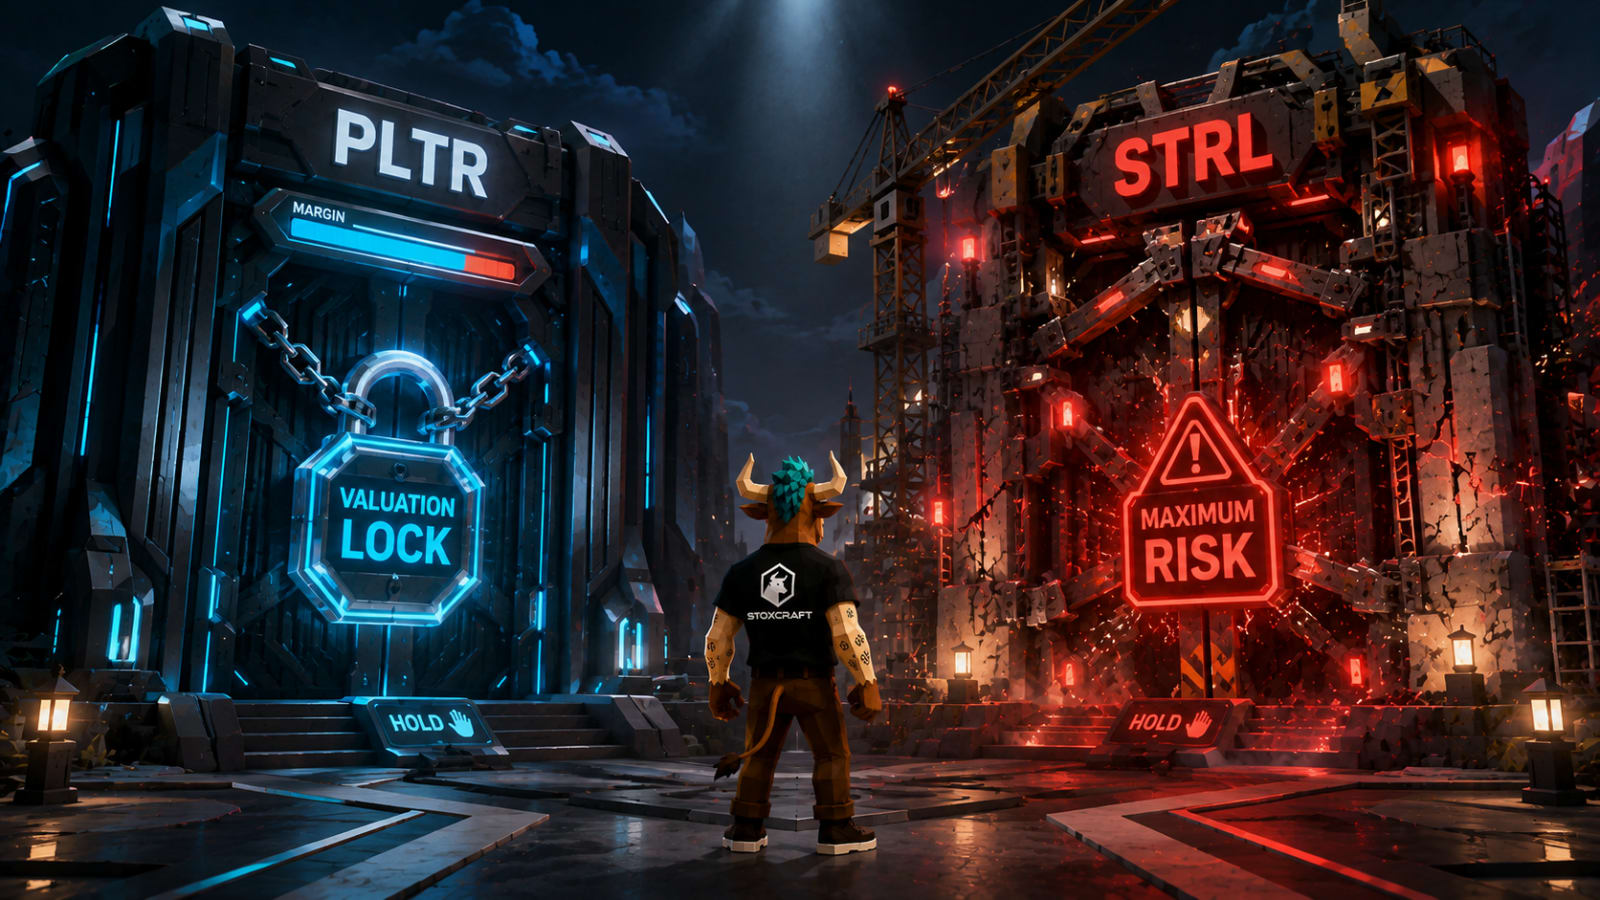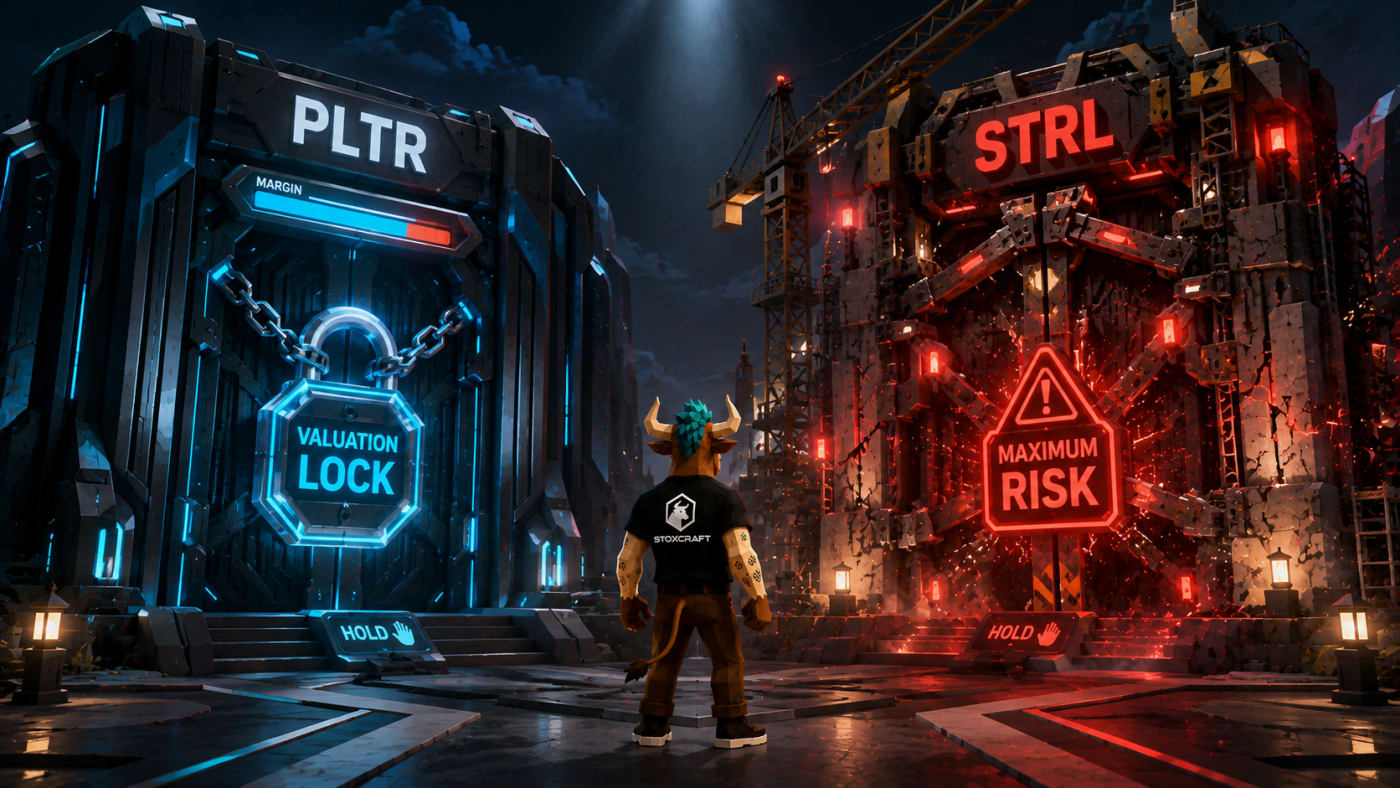
Score | Palantir (PLTR) | Sterling Infrastructure (STRL) |
|---|---|---|
Performance Score | 6.5/10 | 9.3/10 |
Health Score | 7.3/10 | 8.7/10 |
Risk Score (high = more risk) | 7.5/10 | 10.0/10 |
Trend signal | RSI 44, price down 4.8% over 1M | RSI 42, price down 14.8% over 1M |
Entry signal | Hold | Hold |
Overall Rating | ★★★⯪☆ | ★★★⯪☆ |
What PLTR and STRL need to prove Monday
PLTR's own guidance points to Q2 revenue near $1.8B, up roughly 79% year over year, with an adjusted operating margin close to Q1's 60%. The real test is next quarter. TipRanks reports management will likely need to guide Q3 revenue above $2 billion to keep the current valuation intact.
Sterling walks in under a different kind of pressure. Sterling's own Q1 release put signed backlog at $3.8B, up 78% year over year, with combined backlog near $5.2B. Management has already raised full year revenue guidance twice this year on the back of that pipeline.
Quick disclaimer: Stoxcraft scores and analysis are informational tools, not investment advice.
PLTR's setup right now
PLTR's health and performance profile
PLTR's Health Score of 7.3/10 ranks 9th among Software - Infrastructure stocks in the Stoxcraft screener. Net profit margin sits above 43%, one of the highest readings in the group.
Performance is the weaker link. A 6.5/10 Performance Score puts PLTR 15th in the same industry group. The stock is down 23% over the past year even after a 549% three year run.
PLTR's risk and entry signal
The Risk Score reads 7.5/10. Higher means more risk, and more than 30 Software - Infrastructure names actually carry a higher score, so PLTR sits mid-pack on volatility rather than at the extreme.
The entry signal reads Hold. RSI, a 0 to 100 gauge of buying and selling pressure, sits at 44, showing neither panic nor conviction heading into the print.
STRL's setup right now
STRL's health and performance profile
STRL's Health Score of 8.7/10 ranks 2nd of 42 stocks in Engineering & Construction. Cash flow per share and interest coverage both sit near the top of the sector.
Performance is even stronger. A 9.3/10 Performance Score ranks 3rd in the same 42 stock group, backed by a 120% one year gain and a 866% three year run.
STRL's risk and entry signal
STRL's risk profile creates real tension. The Risk Score just hit 10.0, tied for the single highest reading of any Engineering & Construction stock Stoxcraft tracks. That's up sharply since early June, per the Stoxcraft scoring methodology.
Max drawdown over the past year sits at 14%, and the stock is 41% below its 52 week high. The entry signal reads Hold despite the backlog underneath it.
Three numbers to watch Monday
Neither report is really about the headline beat. These are the numbers that decide which way each scoreboard moves next.
For PLTR
- Q3 revenue guidance above $2B keeps the growth story intact.
- Adjusted operating margin at or above 59% shows profitability isn't slipping.
- US commercial growth staying in triple digits backs the valuation.
For STRL
- Backlog growth beyond the $3.8B signed mark confirms demand hasn't peaked.
- Gross margin holding near 23% shows the mix is still working.
- Any signal that data center or semiconductor spending is cooling matters most, since that's what the Risk Score is already pricing in.
PLTR and STRL against their sectors
PLTR trails the strongest names in Software - Infrastructure on both health and performance, a middle of the pack profile inside a crowded, high multiple group. STRL is the opposite story. It's one of the two or three best fundamental and performance profiles in Engineering & Construction, paired with the single riskiest score in that same group.
The score pattern each stock fits
STRL is close to a textbook Momentum Play, pairing top tier fundamentals with the single riskiest score in its sector.
PLTR is harder to slot into one bucket. Health outpaces Performance, which is closer to a Quality Compounder setup than a pure momentum name, just without the low risk profile that usually comes with that label. A prior Stoxcraft breakdown of PLTR's valuation versus its momentum covers that same tension in more depth.






What decides both scoreboards after Monday
For PLTR, margin discipline and the Q3 guide matter more than the Q2 beat itself. For STRL, another leg up in backlog is what keeps a maxed out Risk Score from becoming the whole story.
Neither report changes what these companies are. It changes which side of their score profile gets louder next week.
Stoxcraft scores are analytical tools built from independent data, not buy or sell recommendations. This article is for informational purposes only and isn't financial advice. Always do your own research before making investment decisions.