Smart investing starts with good data. Stoxcraft scores are analytical tools, not buy or sell recommendations. This article is for informational purposes only. Make sure any investment decision fits your own situation - and when in doubt, talk to a financial advisor.

A viral margin chart, and where it gets complicated


A chart ranking semiconductor companies by margin made the rounds on social media this week. It put Micron (MU) on top with a 66% operating margin, Nvidia (NVDA) second at 64%, and Western Digital (WDC) tucked into a middle "Strong" tier at 30%.


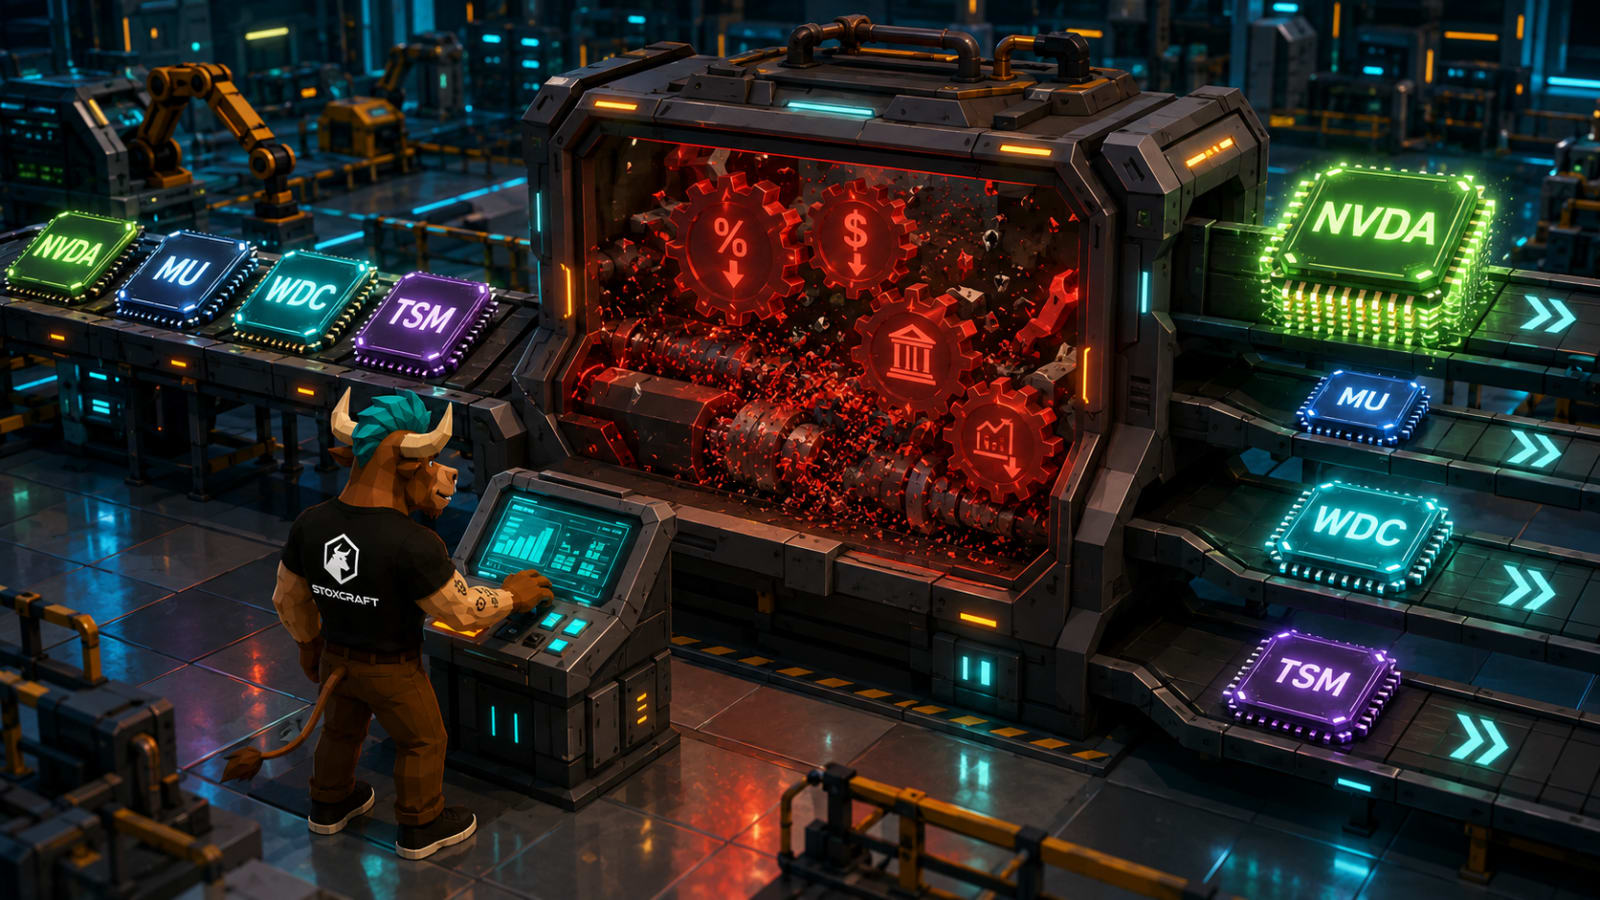
The top three names check out on an operating-margin basis. But operating margin only tells part of the story. Run the same list through Stoxcraft's own net profit margin data, and the order changes. Nvidia moves into first place. Western Digital jumps from the middle of the pack to third overall.


Why Nvidia edges out Micron when you look at net margin


NVDA
Low-poly 3D NVIDIA (NVDA) stock icon with a stylized microchip, symbolizing semiconductors and hardware.
203.67
-1.80%
9.1
8.0
5.7
Sell
Buy
NVIDIA Corporation
TSM
Low-poly 3D TSMC (TSM) stock icon with a stylized microchip, symbolizing technology and software.
398.10
-2.84%
9.5
9.1
4.9
Sell
Buy
Taiwan Semiconductor Manufacturing Company Limited
MU
Low-poly 3D Micron (MU) stock icon with a stylized memory chip, symbolizing semiconductors and hardware.
877.54
+2.85%
9.4
Sell
Buy
Micron Technology, Inc.
WDC
Western Digital Corporation
481.81
+3.21%
9.6
Sell
Buy
Western Digital Corporation


The 10-point gap that flips the ranking


Nvidia's operating margin (64%) and Micron's (66%) look nearly identical on a single chart. Once taxes and non-operating costs are factored in, Nvidia converts more of that operating profit into net income. On Stoxcraft's own data, Nvidia comes out on top of the full 19-name screener at 63.0%. Micron drops to 55.9%, a 10-point swing from its widely-shared operating figure and the largest gap of any name on the list.


That gap matters. Operating margin measures what a company keeps before the tax bill and non-operating items arrive. Net profit margin measures what actually reaches the bottom line. Same company, same quarter, two very different numbers depending on which line of the income statement you read.


Taiwan Semiconductor shows what consistency looks like


Taiwan Semiconductor (TSM) tells a different story. Its operating and net margins stay close together, 53% and 47.0% respectively, a spread of just 6 points. That consistency signals a business with fewer non-operating swings distorting the bottom line. TSM's profitability is less sensitive to one-off items than either Nvidia's or Micron's, which is its own form of quality.


None of this makes Micron a weaker business. A 55.9% net margin is still elite by any standard. It just means the viral chart's "best-in-class" framing, based on operating margin alone, missed which company actually keeps more of every dollar earned.


Western Digital: the name the original ranking undersold


The bigger surprise sits further down the original post. Western Digital was placed in a "Strong (30-39%)" tier based on a 30% operating margin, solid but unremarkable next to the chip leaders above it.


Stoxcraft's net margin data tells a different story. Western Digital's net profit margin comes in at 55.1%, the third-highest figure across all 19 names screened, just behind Nvidia and Micron and ahead of Taiwan Semiconductor.


The gap between Western Digital's operating and net margin is unusually wide for a storage hardware name. It points to a company whose bottom-line profitability, likely helped by favorable tax treatment or gains outside core operations, is not fully captured by the operating-margin lens the original chart used. Investors screening purely on operating margin would have ranked Western Digital well behind where its actual profit conversion places it.


The full screener: 19 semiconductor names by net margin


Here are all 19 names from the original viral post, ranked by Stoxcraft's net profit margin TTM data from highest to lowest:


  1. Nvidia (NVDA): 63.0%
  2. Micron (MU): 55.9%
  3. Western Digital (WDC): 55.1%
  4. Taiwan Semiconductor (TSM): 47.0%
  5. Broadcom (AVGO): 38.8%
  6. Arista Networks (ANET): 38.3%
  7. KLA (KLAC): 35.7%
  8. Credo Technology (CRDO): 35.4%
  9. Sandisk (SNDK): 34.2%
  10. Lam Research (LRCX): 30.9%
  11. ASML (ASML): 29.7%
  12. Applied Materials (AMAT): 29.3%
  13. Marvell (MRVL): 29.0%
  14. Astera Labs (ALAB): 26.7%
  15. Arm (ARM): 18.4%
  16. Lumentum (LITE): 17.7%
  17. AMD (AMD): 13.4%
  18. ON Semiconductor (ON): 9.5%
  19. Coherent (COHR): 7.1%


One name from the original viral chart is missing here on purpose. SK Hynix (SKHY) raised $26.5 billion in its Nasdaq debut on July 10, 2026, the largest-ever US listing by a foreign company. It's too new to have Stoxcraft coverage yet, so it's excluded from the ranked screener above rather than estimated.


Operating margin vs. net margin: two numbers, one company


What each metric actually measures


Operating margin tracks what a company keeps from its core business, before taxes, interest, and one-off items enter the picture. Net profit margin tracks what lands on the bottom line after all of that. Same revenue. Different endpoints.


The two numbers usually move together. When they diverge sharply, as they do for Micron and Western Digital, the gap is telling you something specific. Tax structure, one-time gains, interest expense, and non-operating income can all widen or narrow that distance in either direction.


Why a single-metric ranking always has a blind spot


Pick operating margin and you miss Western Digital's bottom-line conversion. Pick net margin and you lose some of the signal on core business efficiency. Neither figure is wrong. Both are incomplete on their own. A complete picture of semiconductor profitability requires at least two lines of the income statement, not one.


NVDA
Low-poly 3D NVIDIA (NVDA) stock icon with a stylized microchip, symbolizing semiconductors and hardware.
203.67
-1.80%
9.1
8.0
5.7
Sell
Buy
NVIDIA Corporation
AVGO
Low-poly 3D Broadcom (AVGO) stock icon with a stylized microchip, symbolizing technology and software.
373.11
-0.36%
6.7
Sell
Buy
Broadcom Inc.
TSM
Low-poly 3D TSMC (TSM) stock icon with a stylized microchip, symbolizing technology and software.
398.10
-2.84%
9.5
9.1
4.9
Sell
Buy
Taiwan Semiconductor Manufacturing Company Limited
ASML
Low-poly 3D ASML (ASML) stock icon with a stylized microchip, symbolizing technology and software.
1,767.16
-0.99%
4.9
Sell
Buy
ASML Holding N.V.
AMD
Low-poly 3D AMD (AMD) stock icon with a stylized microchip, symbolizing technology and software.
497.63
-0.66%
8.6
Sell
Buy
Advanced Micro Devices, Inc.
ARM
Low-poly 3D Arm (ARM) stock icon with a stylized microchip, symbolizing semiconductors and hardware.
269.39
+2.82%
9.6
Sell
Buy
Arm Holdings plc American Depositary Shares
AMAT
Low-poly 3D Applied Materials (AMAT) stock icon with a stylized silicon wafer, symbolizing mining and materials.
534.12
-4.78%
7.9
Sell
Buy
Applied Materials, Inc.
MU
Low-poly 3D Micron (MU) stock icon with a stylized memory chip, symbolizing semiconductors and hardware.
877.54
+2.85%
9.4
Sell
Buy
Micron Technology, Inc.
LRCX
Low-poly 3D Lam Research (LRCX) stock icon with a stylized silicon wafer, symbolizing technology and software.
312.46
-2.65%
8.7
Sell
Buy
Lam Research Corporation
KLAC
Low-poly 3D KLA (KLAC) stock icon with a stylized microscope, symbolizing healthcare and biotech.
212.87
-2.96%
9.0
Sell
Buy
KLA Corporation
MRVL
Marvell Technology, Inc.
189.90
+0.85%
9.6
Sell
Buy
Marvell Technology, Inc.
ANET
Low-poly 3D Arista Networks (ANET) stock icon with a stylized network switch, symbolizing technology and software.
169.01
+0.27%
6.0
Sell
Buy
Arista Networks, Inc.
ON
ON Semiconductor Corporation
87.80
-0.36%
9.5
Sell
Buy
ON Semiconductor Corporation
ALAB
Astera Labs, Inc. Common Stock
303.10
-5.20%
9.9
Sell
Buy
Astera Labs, Inc. Common Stock
CRDO
Credo Technology Group Holding Ltd
204.68
-1.58%
9.8
Sell
Buy
Credo Technology Group Holding Ltd
LITE
Lumentum Holdings Inc.
737.41
+4.42%
9.0
Sell
Buy
Lumentum Holdings Inc.
COHR
Coherent, Inc.
279.41
+0.88%
9.8
Sell
Buy
Coherent, Inc.
SNDK
Sandisk Corporation
1,433.14
+1.56%
10.0
Sell
Buy
Sandisk Corporation
WDC
Western Digital Corporation
481.81
+3.21%
9.6
Sell
Buy
Western Digital Corporation


What Nvidia's 63% says about semiconductor profitability in 2026


The real lesson from this week's viral chart isn't that it was wrong. The top three names it flagged, Micron, Nvidia, and Taiwan Semiconductor, are legitimately among the most profitable semiconductor companies tracked anywhere. The lesson is that the same companies rank differently depending on which line of the income statement you measure.


Nvidia's net margin lead and Western Digital's under-the-radar third-place finish are the two numbers worth keeping from this. For a broader look at how the AI buildout is reshaping profitability across the chip sector, see Stoxcraft's earlier coverage of the chip boom.

Key Facts

  1. Nvidia leads 19 semiconductor names with a 63.0% net profit margin TTM.
  2. Micron drops 10 points from operating to net margin, the largest swing on the list.
  3. Western Digital ranks third at 55.1% net margin despite a "Strong" 30% operating margin in the original post.
  4. SK Hynix raised $26.5 billion in the largest-ever US Nasdaq listing by a foreign company on July 10, 2026.

HypeMeter
HypeMeter-img
38%
Red Flags
38%
Red Flags
Premium
Choose your Style
Armin Skelic
Armin Skelic
Founder of Stoxcraft, Stock Market Analyst & Financial Content Strategist

What does it mean?

positive
Positive Impact
  • Record Financials: Record services revenue and a significant EPS increase are signs of strong financial health, usually boosting investor confidence and potentially stock prices.
  • Growth in Active Devices: Over 2.2 billion active devices enhance Apple's ecosystem, promising more revenue from services and sales, thus attracting investors.
  • Shareholder Returns: Dividends and buybacks signal management's confidence in Apple's profitability, positively affecting stock prices.
positive
Negative Impact
  • Record Financials: Record services revenue and a significant EPS increase are signs of strong financial health, usually boosting investor confidence and potentially stock prices.
  • Growth in Active Devices: Over 2.2 billion active devices enhance Apple's ecosystem, promising more revenue from services and sales, thus attracting investors.
  • Shareholder Returns: Dividends and buybacks signal management's confidence in Apple's profitability, positively affecting stock prices.
Curious about how the latest news affects your investments? We break down the key points, highlighting the good and the bad, so you can make smart moves.
Upgrade view

What else is happening in the market.