
Home Depot's CFO told analysts in August that housing turnover has remained at historical lows since 2023, calling the market essentially frozen, with mortgage rates sitting above 6.5% and housing starts down 13.5% year over year. That's the backdrop for Consumer Cyclical's reputation as the boom-and-bust sector. Consumer Defensive has the opposite reputation, steady, recession-proof staples. The full Health Score data across every scored stock in both sectors actually backs the reputation on average, even though Consumer Cyclical's single best name outscores anyone in Consumer Defensive.
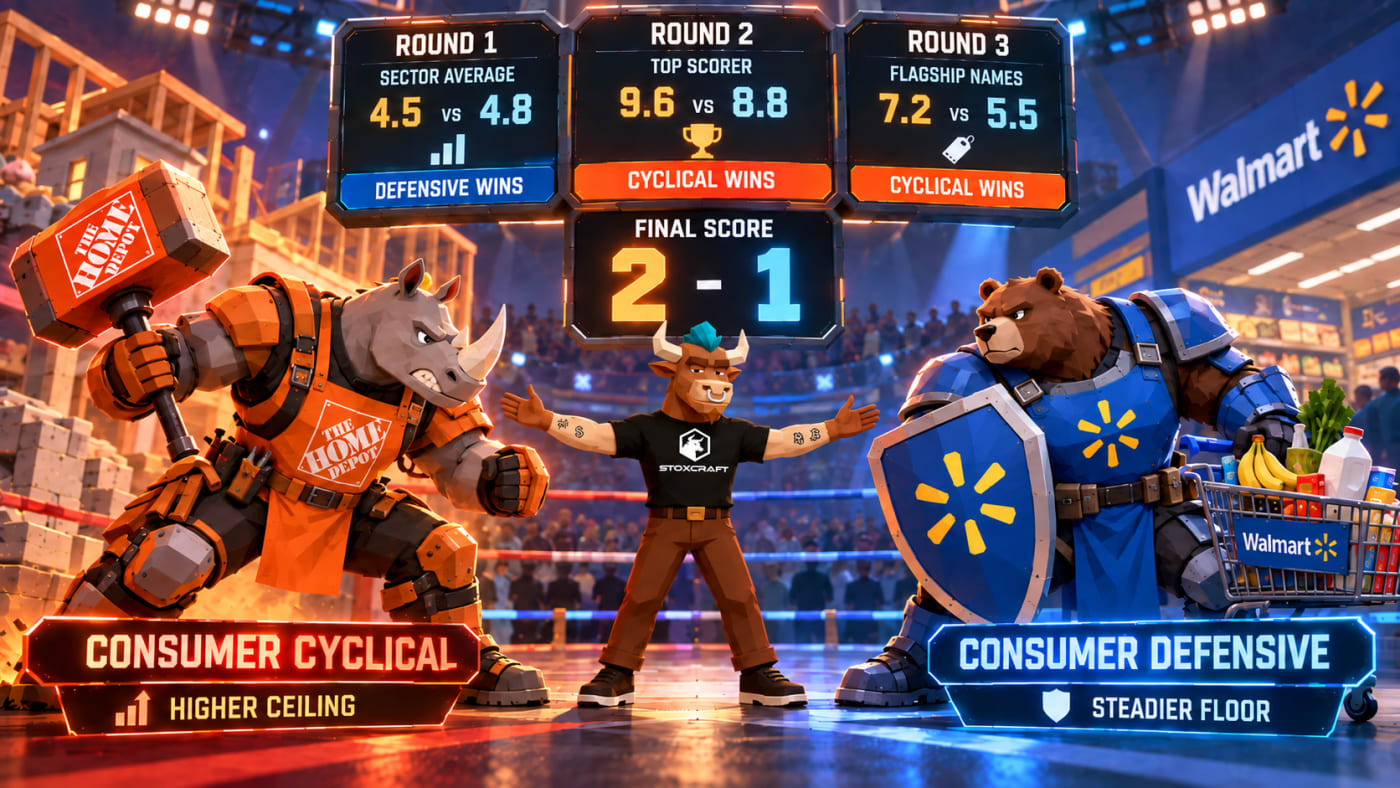
Three rounds decide this: the true sector-wide average, each sector's actual top scorer, and the flagship names most people recognize.
Both flagship names, side by side, before the numbers start.






Round 1: The true sector-wide average
Consumer Defensive averages a 4.8 Health Score across all 174 scored stocks in the sector. Consumer Cyclical averages just 4.5 across all 393 scored stocks, despite housing the single highest individual score of either sector.
That gap comes down to population size as much as anything else. Consumer Cyclical covers more than double the number of scored names spread across dozens of industries, everything from auto manufacturers to casinos to home builders, so its average has far more room to get dragged down by weak names. Lucid Group sits at just 0.4, still burning cash years after its IPO. Consumer Defensive's weak names tend to be smaller and more contained, and even one of its own recognizable names, General Mills, has fallen to a 3.7 Health Score this year on repeated guidance cuts, without dragging the sector's overall average down nearly as much.
Round 2: Each sector's actual top scorer
Ferrari (RACE) carries a 9.3 Health Score, the highest of either sector. Grand Canyon Education, Consumer Defensive's strongest name, sits at 8.9, close behind.
Ferrari's score comes from a business most car manufacturers can only dream of: a 22.27% net profit margin, meaning it keeps about $22 of every $100 in sales as profit, roughly triple what a typical mass-market automaker manages, because Ferrari intentionally makes fewer cars than demand would allow and prices accordingly. Its Altman Z-Score of 7.81 sits well above the 3.0 safe-zone threshold. Grand Canyon Education backs its own score with an even higher 19.63% net margin and a current ratio of 3.65, meaning it holds $3.65 in short-term assets for every $1 of short-term debt, reflecting an asset-light education-services model that doesn't need factories or inventory.
Round 3: The flagship names most people actually recognize
Home Depot (HD) carries a 7.1 Health Score. Walmart (WMT), Consumer Defensive's own most-watched name, sits at 5.8. Home Depot backs its score with an 8.41% net profit margin and an Altman Z-Score of 5.66, solidly in the safe zone. Walmart's margin is thinner at 3.00%, typical for a high-volume discount retailer, though its own Altman Z-Score of 6.19 is actually higher than Home Depot's.
The Health Score gap doesn't tell the whole story of what's happening to either stock right now. Home Depot's own management called the housing market frozen, homeowners locked into 3% and 4% mortgages from 2020 and 2022 have little reason to sell, which means fewer renovation projects and fewer big-ticket purchases, and the stock is down 28.70% over the past year as a result. Walmart is living the opposite story. Walmart raised its full-year outlook after a quarter of double-digit e-commerce growth and membership fee revenue up 17%, even as it flagged a more cautious near-term outlook that briefly knocked the stock lower.
Final score: Consumer Cyclical 2, Consumer Defensive 1
Consumer Cyclical takes the overall win because its ceiling, both at the very top of the sector and at the flagship level most people recognize, is genuinely higher than Consumer Defensive's. Consumer Defensive's one win is the one that matters most for consistency: across the full scored population, it's the steadier sector on average, exactly as its reputation claims, even if its best individual names and flagship don't reach quite as high as Cyclical's do.
One more number worth a look: Home Depot trades at a P/E of 26.50, meaning investors are paying about $26.50 for every $1 of its annual earnings, despite the stock's decline. Walmart trades at a P/E of 43.48, or roughly $43.48 for every $1 of earnings, a notably richer multiple attached to the stock that's actually been delivering.
Here's the full scorecard, both flagship names side by side:
None of that is a buy signal. A cheaper P/E and stronger fundamentals haven't stopped Home Depot's stock from falling while it waits on a housing market it doesn't control, and that's exactly the kind of gap a scorecard alone can't resolve. Curious how other names across either sector stack up. Stoxcraft's screener lets you filter by Health Score and Performance Score yourself.




