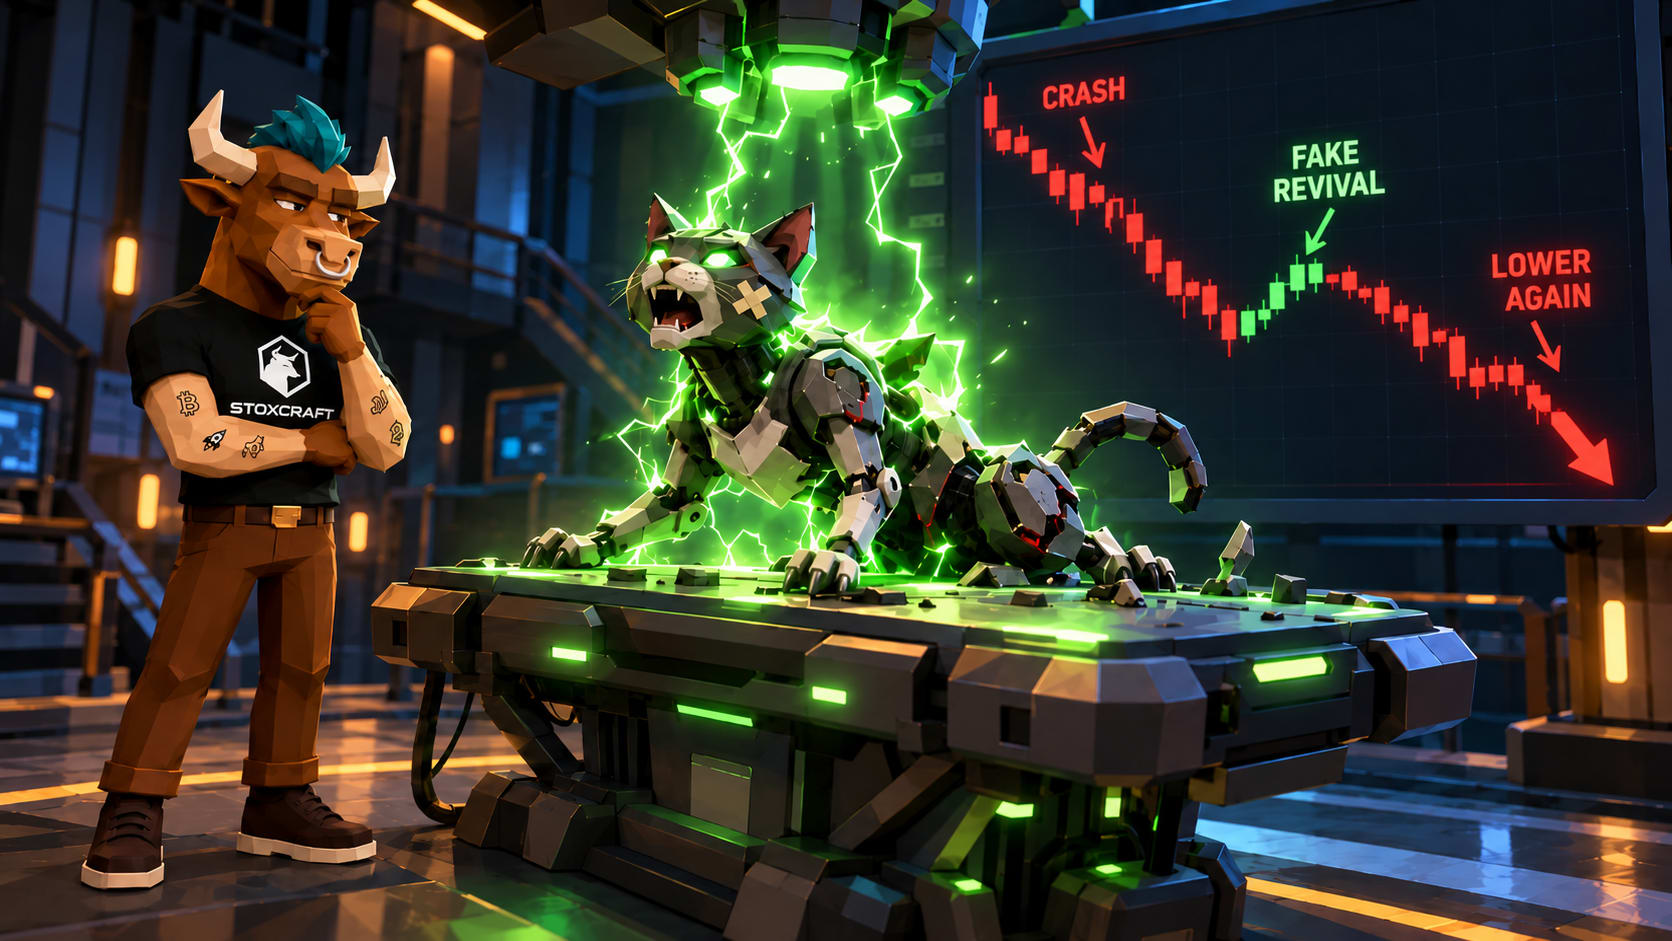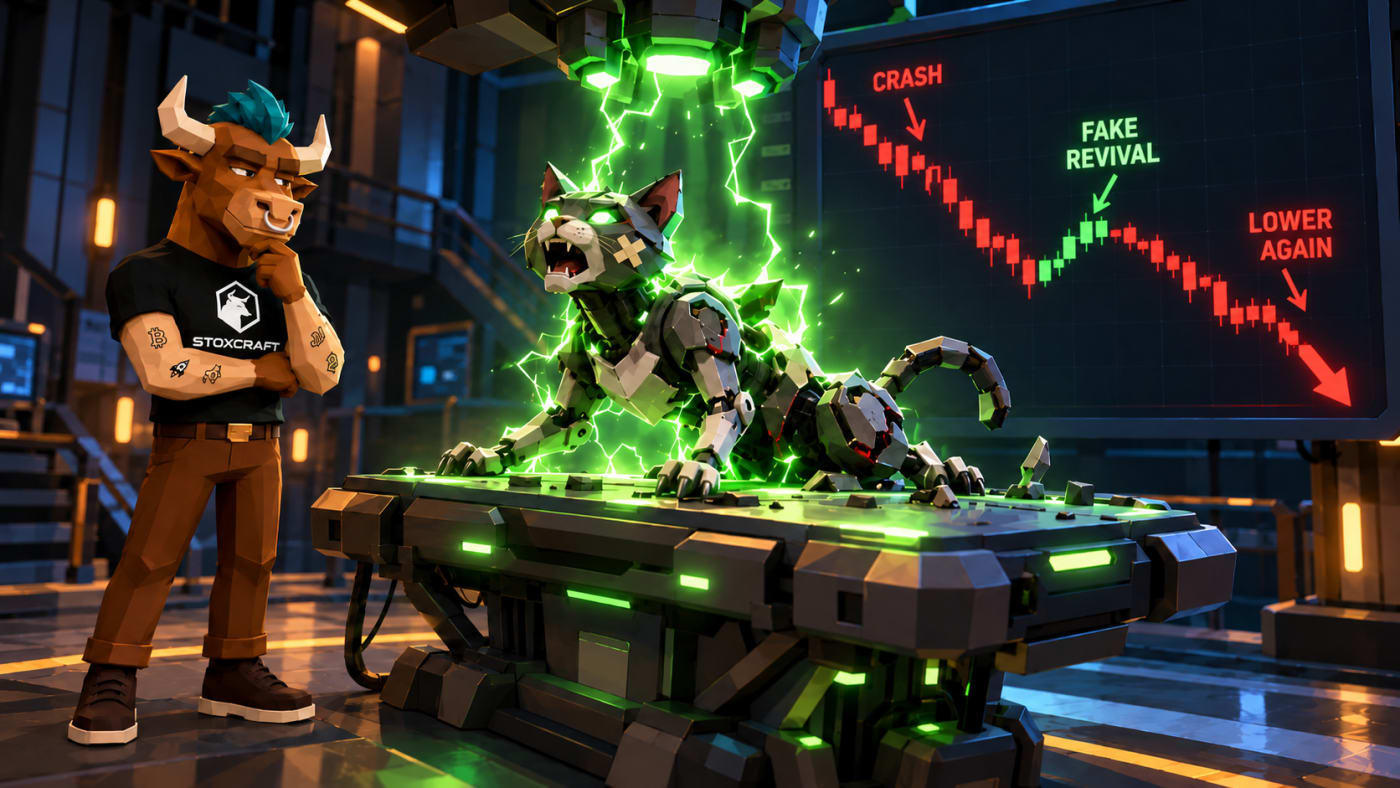
A dead cat bounce is a rally after a big drop that eventually fizzles out. The stock looks like it's recovering. Sellers are still running the show.
That gap between how it looks and what's real costs people money. They buy the comeback and end up bag holding when the drop resumes. Knowing the signs makes that trap easier to avoid.
The timing isn't random either. September was rough on smaller, riskier stocks, and many crashed names are bouncing now. Some will recover, many won't.
What is a dead cat bounce?
A dead cat bounce is a brief price rally inside a longer downtrend. The stock jumps, traders get excited, then the price rolls over to a new low. The bounce was never a turnaround, just a pause.
The name is dark on purpose. An old trader saying goes: even a dead cat bounces if it falls from high enough. The bounce doesn't mean it's alive.
The phrase first showed up in the Financial Times in December 1985. It described a short rally in Singapore and Malaysia. The next year, analyst Raymond DeVoe Jr. helped popularize it with a quip about oil prices.
A simple example shows how it plays out on a chart.
Look at the math again. A 37.5% rally sounds huge, but it only won back a quarter of the crash. Big percentages off a low base mean less than they look.
Why a dead cat bounce happens
Bounces don't come out of nowhere. Three forces usually push a crashed stock higher for a while.
- Short covering: traders who used short selling buy shares back to lock in gains. That buying lifts the price fast.
- Bargain hunters: some investors see a 60% drop and think cheap. Dip buying feels smart until the dip keeps dipping.
- Oversold readings: indicators like the RSI flag the stock as oversold. Chart traders and algorithms jump in, expecting a snap back.
Most of these buyers are betting on the price, not the business. Many think in days, not years. Once they're done buying, the old sellers return.
How to tell a dead cat bounce from a real recovery
No single signal is proof. Four checks together give you a much clearer read on any bounce.
Trading volume during a dead cat bounce
Volume is the number of shares traded. It shows how many people back a price move. A real recovery usually comes with rising volume as big buyers keep stepping in.
A dead cat bounce often rises on thin volume. Few shares change hands, so a small group can push the price around. Light volume on up days and heavy volume on down days means sellers still rule.
One giant volume day isn't enough, though. Real recoveries keep volume strong on up days for weeks.
Old support turning into resistance after a crash
Support is a price level where buyers used to step in. Once a stock crashes through it, that level often flips. It becomes resistance, a ceiling where trapped buyers wait to sell at break even.
Watch where the bounce stalls. If it dies right at the old support line, that's a classic dead cat signal. A real recovery pushes through that level and holds above it.
Company fundamentals behind a bouncing stock
Charts show what traders do. Fundamentals show whether the business deserves a higher price. Ask simple questions about revenue, cash and debt.
Is revenue growing? Is the company burning cash? Can it pay what it owes?
If nothing in the business changed, the bounce is just trading noise. A real recovery usually has a reason, like better earnings or a fixed balance sheet.
The broader market trend behind a bounce
Single stocks rarely swim against a strong current. In a bear market, bounces in weak stocks tend to fail.
The S&P 500 isn't in a bear market right now. Still, the backdrop is tough for weak companies. The 10-year Treasury yield hit 5.29% at the end of September, a multi-decade high.
Higher yields make risky, cash-burning companies a harder sell. Put all four checks together and you get a quick scorecard.
Want to go deeper on volume, support and trends? The Stoxcraft Academy's Chart and Technical Analysis island maps out the full skill path.
How long does a dead cat bounce last?
There's no fixed timer. It depends on the chart you watch. A bounce on a daily chart might last a few days.
A bounce on a weekly chart can run for months and still fail. Smaller bounces can even sit inside bigger ones. Your timeframe decides what counts.
The hard truth: you can't confirm a dead cat bounce until the stock makes a new low. Before that, it's just a rally. That's why the label only sticks in hindsight.
Even pros get this wrong. In April 2020, a Forbes contributor called the S&P 500’s 24% rebound a dead cat bounce. The index kept climbing to new highs instead.
Is a dead cat bounce bullish or bearish?
Bearish. A dead cat bounce is a continuation pattern, which means the downtrend resumes after the pause. The green candles are what fool people.
The pattern only exists because the stock goes lower afterward. If the price keeps rising, it was never a dead cat bounce. It was the start of a recovery.
[EMBED: interactive quiz, dead cat bounce or real recovery]
Real bottoms tend to look different. They often follow capitulation, when panicked sellers dump shares on huge volume. After that flush, far fewer sellers are left.
Forced selling can make that flush even more violent. Our breakdown of why leveraged selloffs feel different shows how margin calls speed it up.
A real bottom also tends to build momentum, with higher lows over the following weeks. One big green day proves nothing on its own.
Crashed stocks that bounced in Stoxcraft data
Theory is nice. Data is better. We pulled three stocks from the Stoxcraft universe that fell sharply and then bounced.
This isn't a prediction for any of them. It's an illustration of what the warning signs look like in real numbers. The list and scores below use Stoxcraft data as of October 7, 2026.
- Cango (CANG): down 28% over six months, up 38% in one month
- Dye & Durham (DND.TO): down 71% over six months, up 61% in one month
- Murano Global Investments (MRNO): down 57% over six months, up 16% in one month
The bounces look great on a one-month chart. The fundamentals tell a different story.
All three have a Health Score of 0.6 or lower. That score runs from 0 to 10 and compares companies within their own sector. Below 5 means weaker fundamentals than most peers.
Their Risk Scores sit between 8.5 and 9.3. On this score, higher means more risk, so these rank among the riskiest stocks we track. Each one gets just half a star in the Overall Rating.









Dye & Durham shows how wild these bounces get. It jumped 144% on September 29, on more than five times its usual volume. It gave back 14% the next day, popped again, then fell 11% on October 6.
The company also carries about C$1.3 billion in debt. Its whole market value is under C$90 million.
Murano tells a similar story. It spiked 57% on September 18 on more than 300 million shares traded. Within three weeks, it gave back most of that gain.
In 2025, Cango posted a net loss of about $453 million on $688 million in revenue. Murano's current assets cover barely a quarter of its short-term bills. None of these look like recovery stories yet.
What to do when a crashed stock suddenly bounces
Don't chase the first green candle. A bounce is a question, not an answer. Run a short routine before you buy anything.
- Compare volume on the up days with volume on the down days.
- Mark the old support level and see if the price breaks it.
- Look for a real change in the business, not just the chart.
- Set your exit price before you enter, not after.
If the stock passes, you at least have a case. If it fails, you just avoided becoming exit liquidity for someone else. The old high price makes this harder than it sounds.
That pull is anchoring, one of the five biases that mess up your investor mindset. The Stoxcraft Screener lets you check the fundamentals behind any stock we cover.
A dead cat bounce is a pause in a fall, not a comeback. Treat every bounce as guilty until volume, price and the business prove otherwise.