
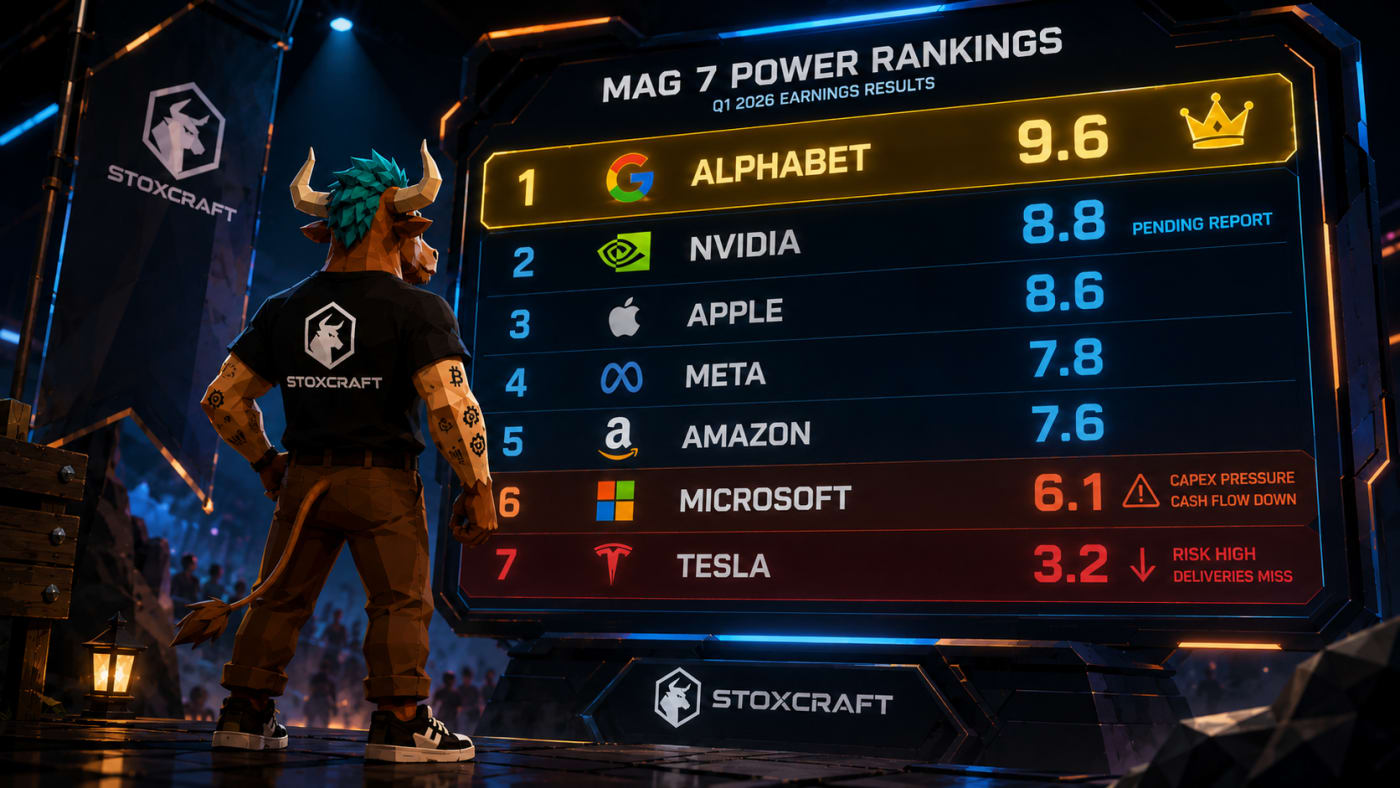
Five of the Magnificent Seven have now reported Q1 2026 earnings. The headline numbers are widely covered. Cloud beats. AI capex surprises. EPS misses and beats. Markets reacted fast in both directions.
What hasn't been done yet is a direct comparison of where the fundamental scores actually land after those reports. Not price. Not sentiment. The underlying data.
Alphabet (GOOG) is the clear leader. Microsoft (MSFT) carries the widest gap between its stock price surge and its fundamental score. Nvidia (NVDA) hasn't reported yet. It does this Wednesday, May 20. Here's the full breakdown.
What five Mag 7 earnings actually delivered
The April rally set the backdrop. The Nasdaq posted a 13-day winning streak, its longest since 1992. Markets came in deeply oversold after a brutal March. Corporate earnings then shifted the narrative further.











Alphabet fired on every metric. Meta beat on advertising revenue. Amazon Web Services posted accelerating cloud growth. Apple came in with a measured, solid quarter. Microsoft beat on Azure growth but raised capex guidance to $190 billion for 2026, spooking markets despite the actual beat.
Tesla reported separately on April 22 with improved margins but missed deliveries. Nvidia is the final name. Its earnings on Wednesday close the Q1 cycle for the group.
How the scores rank all seven Mag 7 names after Q1
These scores draw on quarterly financial results, multi-year price performance, and risk data. One strong quarter doesn't erase years of history. But it does move the picture. The scores below incorporate Q1 2026 earnings data where reported.
Alphabet (GOOG) and Nvidia (NVDA): the top two overall ratings
Alphabet (GOOG) holds the highest overall rating in the Mag 7 at 9.6. Its health score of 9.3 places it at the very top of the Stoxcraft universe. The momentum reading of 9.9 is exceptional. That score reflects a technical picture that's almost as strong as the scale allows.
The Q1 numbers explain the score. Google Cloud revenue surged 63% to $20.03 billion, clearing the $18.05 billion analyst estimate by nearly $2 billion. It was Alphabet's strongest cloud quarter ever. The cloud backlog nearly doubled to $460 billion. Total revenue hit $109.9 billion. EPS of $5.11 grew 82% year over year. This isn't just one good quarter. It's an acceleration on top of already high scores.
Nvidia (NVDA) holds the second-highest overall rating at 8.8. Its health score reflects one of the strongest financial profiles in the global semiconductor sector. Years of extraordinary performance versus benchmarks drive its long-term performance data. NVDA reports Q1 results this Wednesday. Analysts expect earnings growth above 118% and revenue growth near 79%. The four hyperscalers that reported collectively signaled $725 billion in AI infrastructure spending for 2026. That spending flows directly to Nvidia's revenue base.
Apple (AAPL): the third-highest score, upgraded after Q1
Apple (AAPL) holds an overall rating of 8.6, its highest in the current scoring cycle. That puts it in the 5-star tier alongside Alphabet and Nvidia. Q1 2026 was a quieter quarter than the hyperscalers. But Apple's core business delivered. Services revenue continued to grow. The balance sheet strength and cash flow consistency that anchor its health score remained intact. One measured quarter doesn't erode a multi-year foundation built on those fundamentals.
Meta (META) and Amazon (AMZN): strong earnings, strong health profiles
Meta Platforms (META) continues to show one of the highest health scores in the Stoxcraft universe. Advertising revenue growth held up in Q1. The AI infrastructure investment is enormous. But the revenue base absorbs it well. Meta's health data reflects a company generating extraordinary cash returns relative to its sector peers.
Amazon (AMZN) improved its position heading into Q2. AWS posted 28% cloud revenue growth in Q1, its fastest pace in several quarters. Cloud momentum at this scale takes multiple reporting cycles to fully register in long-term performance scores. But the direction is clear and consistent. Amazon's improving trajectory is exactly what the scoring system needs to see.
Microsoft (MSFT): biggest gap between price surge and fundamental score
Microsoft (MSFT) tells the most complicated story in the group. The overall rating is 6.1. That's the lowest of the five hyperscalers and sharply below the group leaders. MSFT surged around 21% from its March lows into late April. The score didn't move with the price.
Here's why the gap exists. Azure grew 40% in Q3 FY2026, beating the 37% consensus estimate. Revenue of $82.9 billion beat expectations. EPS of $4.27 beat forecasts. So the quarter was a genuine improvement. But the score reflects more than one quarter.
Free cash flow dropped 22% year over year. Microsoft guided full-year 2026 capex to $190 billion. That's up 61% from 2025. It's a real burden on the financial metrics that drive health scores. Multi-year performance data also weighs on the rating. The gap between Microsoft's price move and its fundamental score is the most striking divergence in the Mag 7 right now.
Tesla (TSLA): improved margins, but the risk profile remains defining
Tesla (TSLA) holds the lowest overall rating in the group. The Q1 2026 quarter actually showed improvement on margins. Gross margin hit 21.1%, the strongest reading in several quarters and up 478 basis points year over year. That's a real positive.
But vehicle deliveries of 358,023 units missed expectations. Tesla built around 50,000 more vehicles than it sold, creating inventory buildup. Energy storage revenue declined 12% year over year. And the risk score remains the dominant factor. No other Mag 7 member carries the same measured volatility. That caps the overall rating regardless of short-term margin improvement.
Why Alphabet's 9.6 score reflects the strongest Q1 in the Mag 7
A health score of 9.3 isn't achieved in one quarter. It reflects a business that consistently delivers across leverage, profitability, liquidity, and cash generation relative to sector peers. Alphabet has been building that profile for years.
What Q1 2026 did was accelerate it. Google Cloud grew 63% while simultaneously expanding operating margin to 32.9%, up from 17.8% a year earlier. That means the growth is profitable growth. Cloud operating income hit $6.6 billion in the quarter. The backlog of $460 billion means future revenue is already contracted.
The trend reading of 9.9 captures something equally important. Alphabet has been one of the strongest performers in the Mag 7 over the past year. Alphabet (GOOG) has consistently outperformed its peer group since early 2025. The Q1 earnings confirmed what the technical data was already showing. That alignment between the long-term performance picture and the short-term momentum signal is rare. It's what produces a 9.9 trend score.
What Nvidia's Wednesday earnings could change in the Mag 7 rankings
Nvidia holds an 8.8 overall rating without having reported Q1 yet. The incoming results on Wednesday, May 20, will determine whether that rating moves higher or holds.
Analysts expect earnings growth above 118% year over year. Revenue growth is expected near 79%. The broader AI capex story provides the context. Four hyperscalers collectively guided to $725 billion in AI infrastructure spending for 2026. That's up 77% from 2025. Nvidia is the primary beneficiary of that spending.
If the Q1 print comes in near or above expectations, Nvidia's long-term performance data gets stronger. That pushes the overall rating higher. The gap between Nvidia at 8.8 and Alphabet at 9.6 is the number to watch after Wednesday's report.
Alphabet leads the Mag 7 into Wednesday. Here's what the full picture shows
Alphabet won the Q1 earnings season on fundamentals. The data is clear on that. A 9.6 overall rating, a health score of 9.3, and a trend reading of 9.9 don't happen by accident. They reflect an AI business that is accelerating at scale while expanding margins.
Nvidia, Apple, Meta, and Amazon each carry strong profiles. The differences between them are narrower. Nvidia's incoming earnings print is the last variable of the Q1 cycle.
Microsoft tells the most complicated story. One quarter of 40% Azure growth is a genuine signal that the cloud recovery is real. But a score of 6.1 reflects the full picture. Multi-year performance data, a compressed free cash flow position, and a $190 billion capex commitment all factor in. One good quarter shifts the trajectory. It doesn't yet close the gap to the top of the group.
Tesla's margin improvement was the positive surprise of the Q1 cycle. But the risk profile means it stays in a different category than the rest of the group.
You can see updated score breakdowns for all seven names here: Apple (AAPL), Amazon (AMZN), Alphabet (GOOG), Meta (META), Microsoft (MSFT), Nvidia (NVDA), and Tesla (TSLA).



