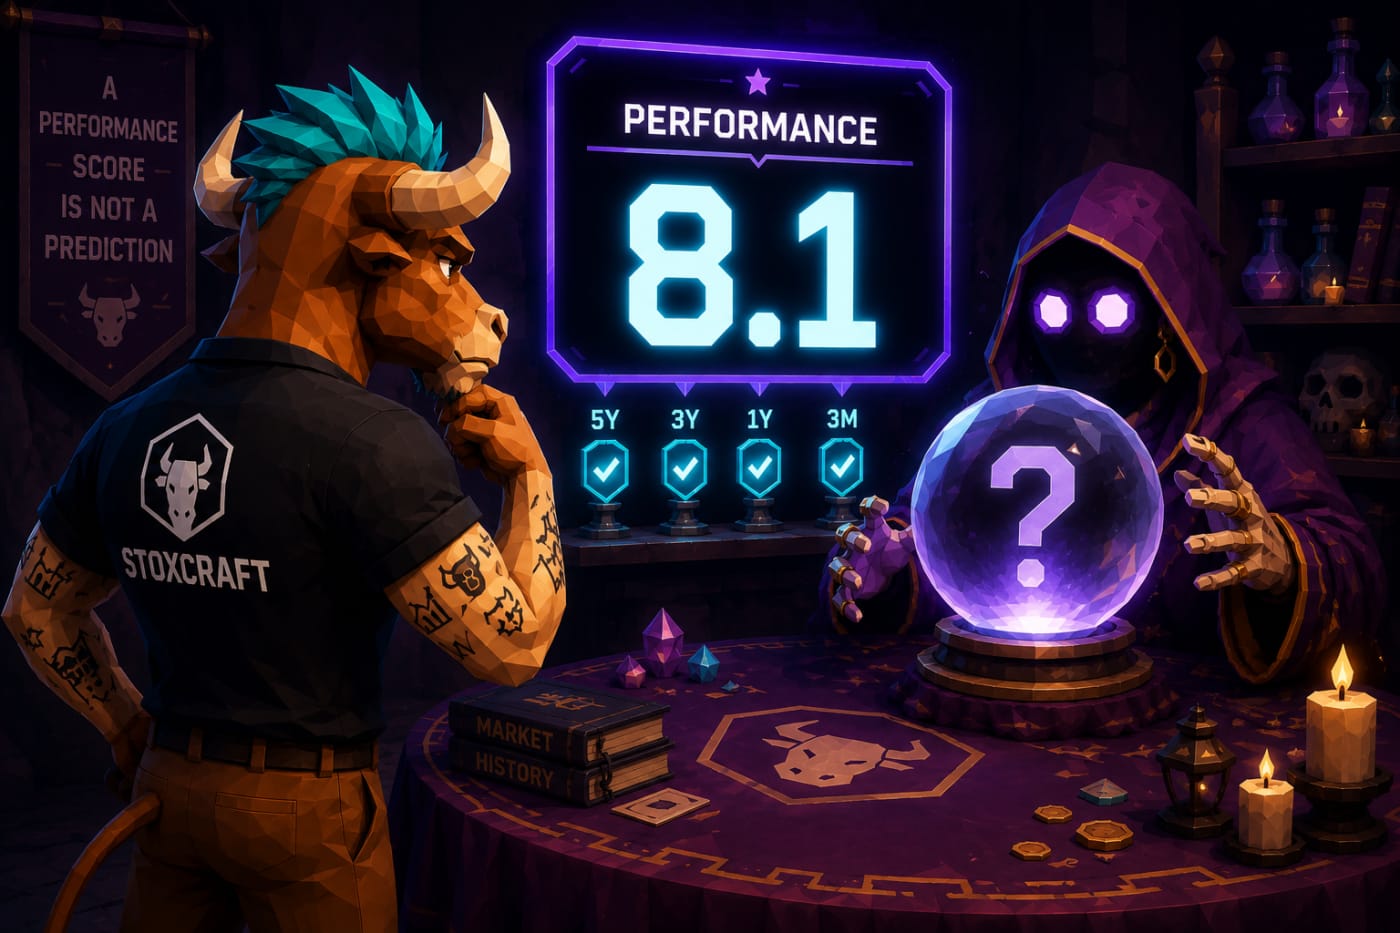
A Performance Score isn't a prediction of where a stock is headed next. It's a read on how well it has actually performed against real benchmarks, and nothing more.
Every stock on Stoxcraft carries one, on a 0 to 10 scale. A high number gets treated like a green light. It shouldn't be.
This piece breaks down exactly what feeds the Stoxcraft Performance Score, what it deliberately leaves out, and how to read it next to Health Score and Risk Score before you act on it.
What the Performance Score actually measures
Performance Score is a track record, not a forecast. It asks one question: how has this stock actually done, compared to the market and to the roughly 3,900 other stocks Stoxcraft tracks?
A score of 5 sits at the middle of that universe. The S&P 500 itself has returned around 10% annualized since 1957, dividends included. Anything that has consistently beaten that pace across multiple timeframes pushes the score up. Anything that has lagged pulls it down.
Above 5 means a stock has outperformed more than half the universe. A 9 or higher puts it among the strongest performers across nearly every timeframe Stoxcraft tracks, not just one lucky quarter.
The score updates as new price data comes in. A name can move a full point in a matter of weeks if momentum shifts hard enough.
One more thing worth locking in early: Performance Score is measured across the full roughly 3,900-stock universe, not sector by sector. Health Score compares a bank to other banks and a chipmaker to other chipmakers. Performance Score skips that adjustment. A semiconductor stock and a utility stock land on the exact same 0 to 10 scale, because the question isn't "did you do well for your sector," it's "did you do well, period."
The inputs: momentum, relative strength, and consistency
Three things feed the number.
Momentum captures how a stock has been trending lately, not just where it sits today. Relative strength measures that same price action against a benchmark: the S&P 500, the stock's own sector, or both. Consistency checks whether the gains show up across multiple timeframes, 5Y, 3Y, 1Y, 3M, or only in one isolated stretch.
A stock that's up hard over one month but flat over five years scores very differently from one that's compounded steadily the whole way. Consistency is what tells those two apart, even when a single snapshot looks identical.
Relative strength is doing more work than it looks like on the surface. A stock up 15% in a year sounds solid, until the S&P 500 is up 25% over the same stretch. Raw returns without a benchmark are close to meaningless. That's why the score never just asks "did the price go up," it asks "did it go up more than the market did, and more than similar companies did."
A real example: same high score, two different stories
NVIDIA (NVDA) carries a Performance Score of 8.1. Its 5-year return tops 1,000%, its 3-year return sits above 400%, and its Health Score is 9.2. That's a stock that has performed and stayed fundamentally sound doing it.
Intel (INTC) carries a Performance Score of 8, almost identical. Its 1-year return tops 300%, driven by a sharp turnaround rally. Its Health Score is just 1.7, among the weakest Stoxcraft tracks, and its Risk Score sits at 8.6, meaning elevated risk from heavy volatility and a steep drawdown history.
Same Performance Score. Completely different setups. One is a steady compounder. The other is a high-risk bet that the rally holds.







Coca-Cola (KO) sits in between, with a Performance Score of 6 and a Risk Score of just 1.6, meaning low risk. It hasn't put up NVIDIA-style numbers, but it hasn't needed a turnaround story either.
The chart below shows why the headline score alone doesn't separate these three.
Reading Performance Score alongside Health and Risk Score
Performance Score alone can't tell you which of those three setups you're looking at. It just tells you the stock has performed. Health Score and Risk Score fill in the rest.
High Performance plus high Health plus moderate Risk generally reads as a quality compounder: strong results built on strong fundamentals. High Performance plus low Health plus high Risk often reads as a momentum play: a real rally, but one riding sentiment more than the balance sheet.
Neither pattern is automatically the better one. They're different bets, and the score combination is what tells them apart.
What the score doesn't tell you
A high Performance Score means a stock has performed well. It does not mean the stock will keep performing well. Past returns are not a forecast, no matter how many timeframes agree with each other.
It also doesn't explain why a stock performed the way it did. Two stocks can post identical 1-year returns for opposite reasons: one from durable growth, one from a rally that's already fading. The score can't tell those apart on its own. The story behind the number can.
And it says nothing about valuation. A stock can score a 9 for how it has performed and still be priced well ahead of what that performance justifies. Performance Score answers "how has this done." It was never built to answer "is this a good price right now." That's a separate question, and Stoxcraft doesn't pretend otherwise.
You can screen by Performance Score directly, alongside Health and Risk, to shortlist names instead of checking tickers one at a time. For the full mechanics of how all three scores relate, the Stoxcraft Formula skill in the Academy walks through it, and The Stoxcraft Scoring System covers the full lineup.
The number tells you what happened, not what happens next
Performance Score is the cleanest read Stoxcraft has on realized returns. It's not a crystal ball, and it was never built to be one.
Pair it with Health Score and Risk Score before deciding anything. That combination gets you closer to the full picture than any single number ever could on its own.